Philippines - A Climatological Overview
Project Information
- Project Files & Code: ph_climate_analysis | GitHub
- Category: Dashboard, Data Analysis, ETL
- Project Date: October 15, 2024
- Tools Used:
- Programming: Python, pandas, pdfquery, Jupyter
- Dashboarding: Tableau
- Other Tools: Excel
I. Introduction
Back when I was younger, I was and still am fascinated with meteorology. It's just that those weather maps I see on TV caught my eye.
Now, that I'm into making dashboards in Tableau, My life-long fascination led me to an idea -- to make something weather related, which is both informative and cool looking. Something which tells a story on how complicated climate and weather of my country, Philippines, as well as the history on significant weather events the people encountered.
In this article, I'll walk you through how I accomplished and created a dashboard which I hope will give the user some information on how it feels like to live in the country and what the Filipinos has gone through, just by being in the tropical part of the globe which is also a hot bed for typhoons, droughts and many more.
How to use the Dashboard
The dashboard has 3 main sections:
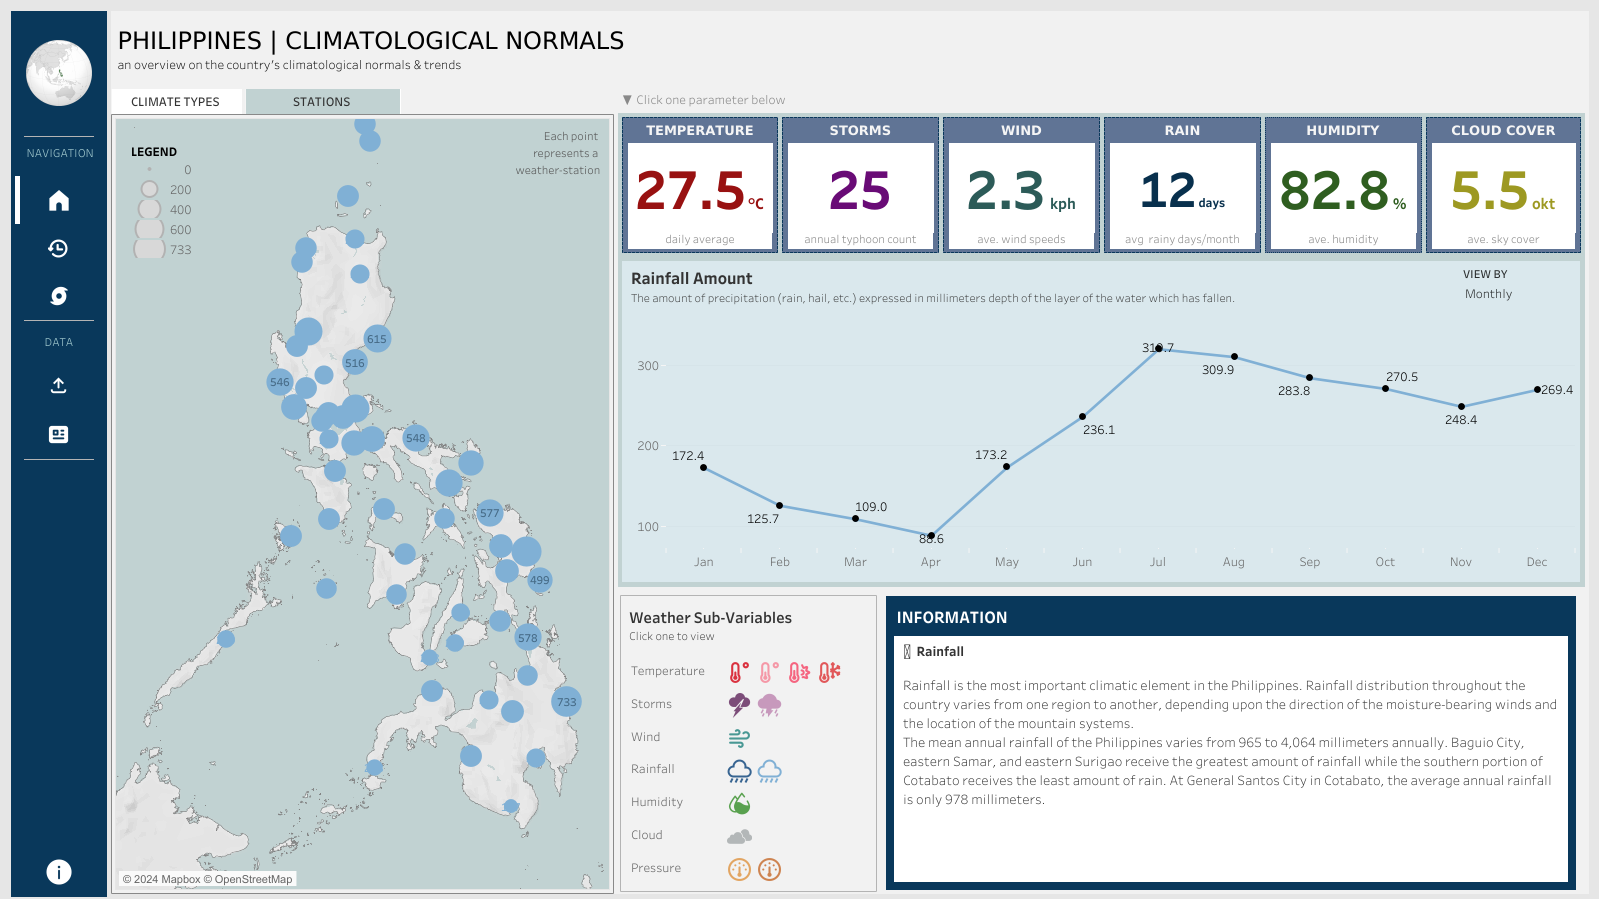
- Climatological Normals
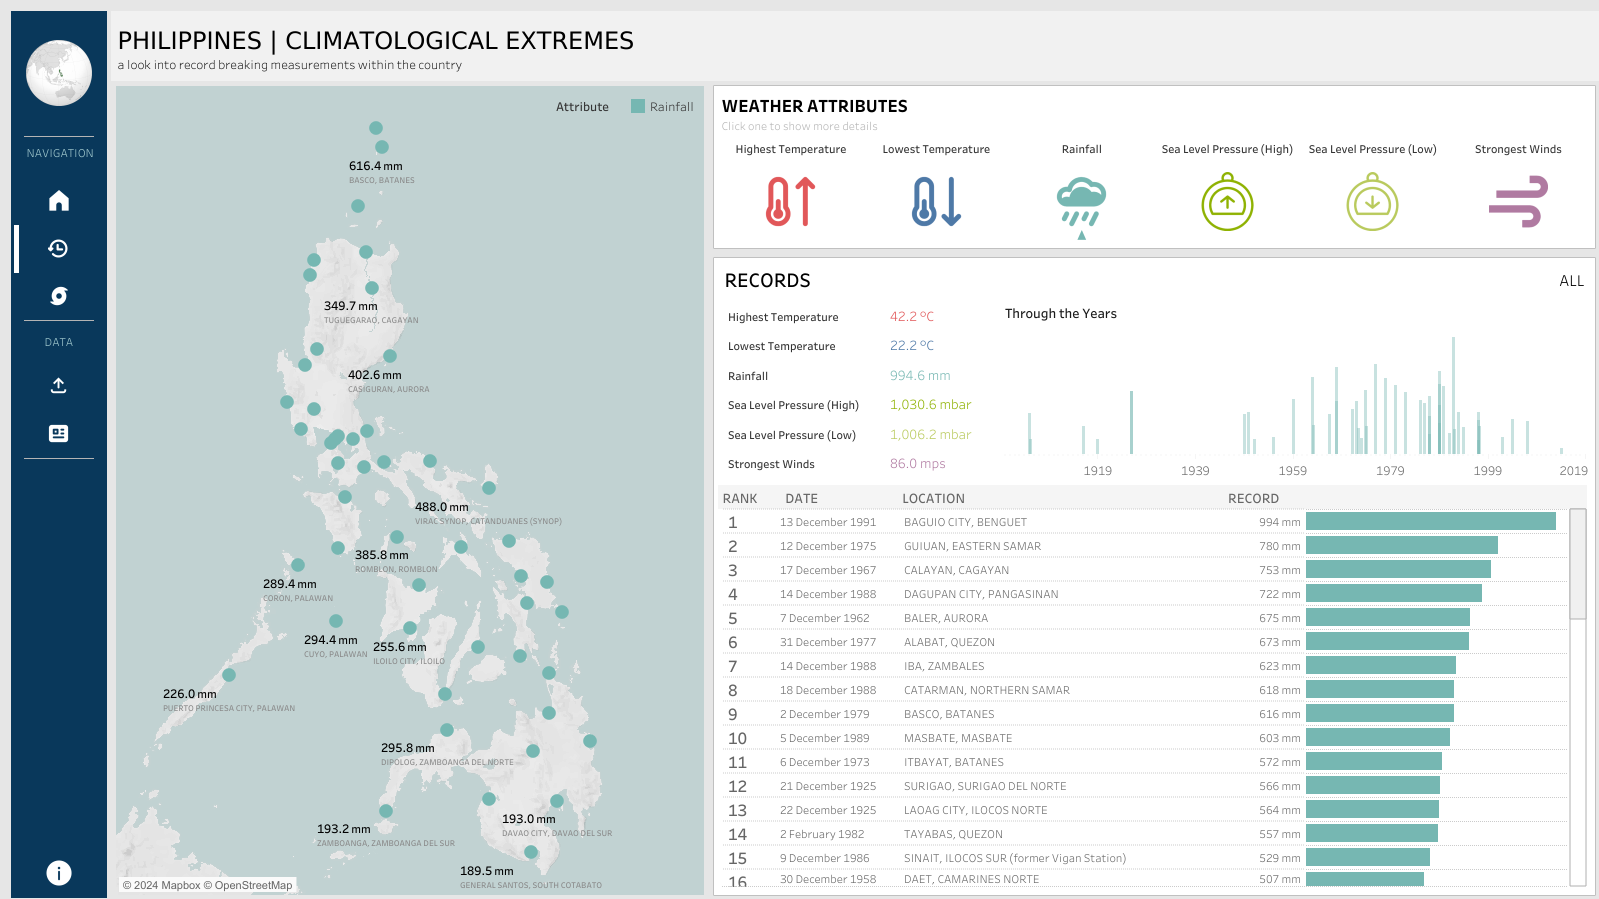
- Climatological Extremes
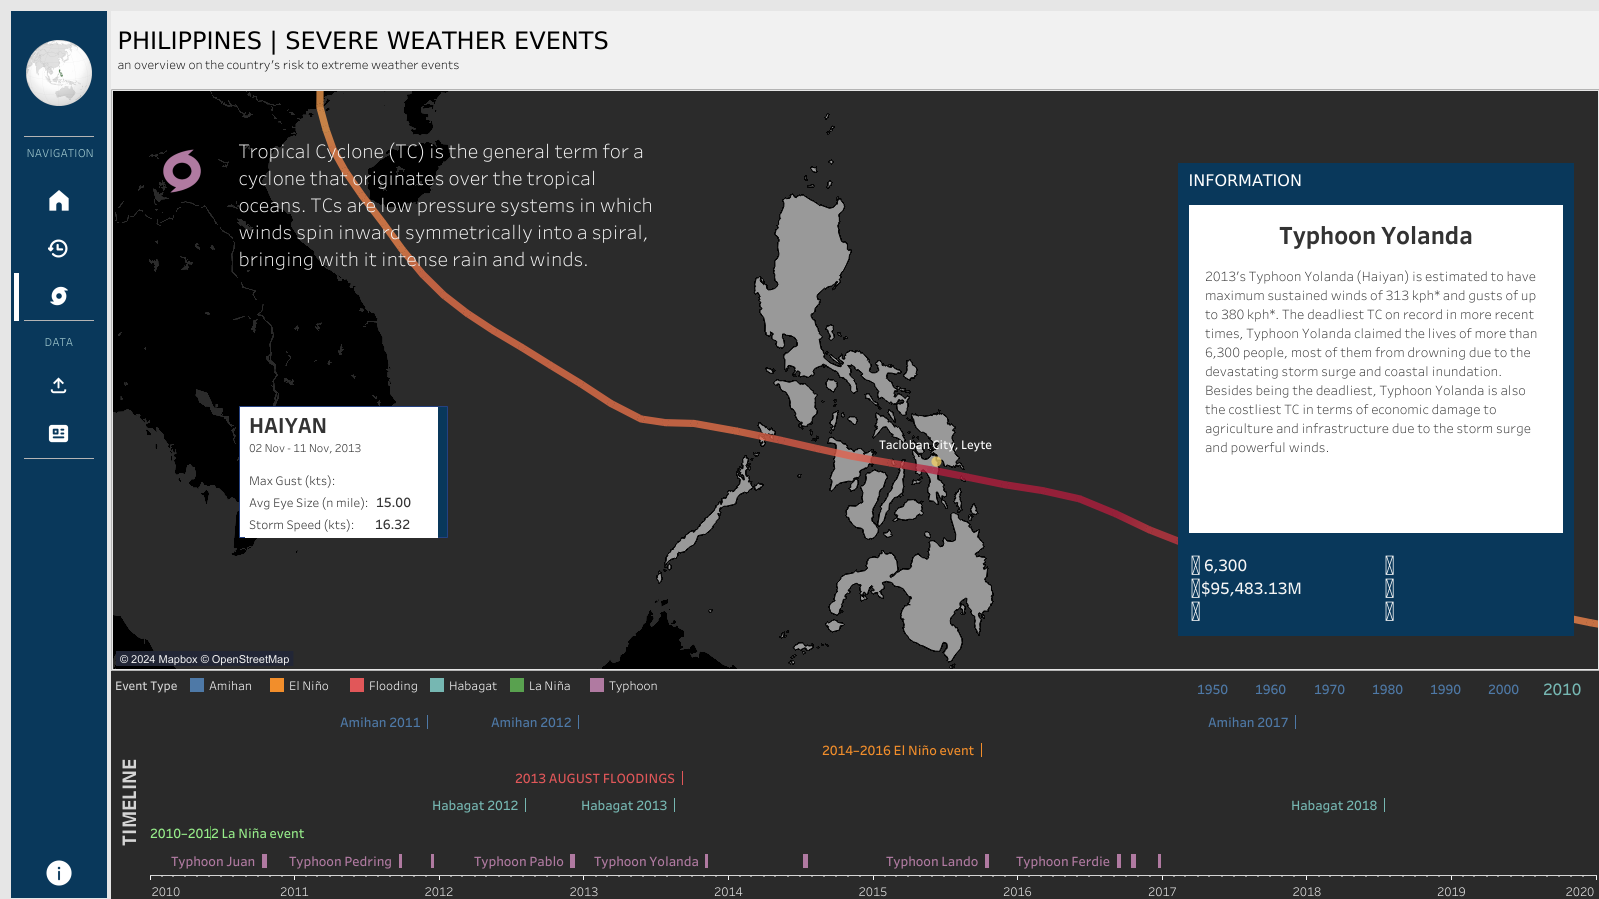
- Historical Severe Weather
Climatological Normals
Climatological Extremes
Historical Severe Weather
II. Implementation
Data Collection
After looking through the internet, everything that I could find, I identified a couple of trusted data sources.
PAG-ASA Website
The PAG-ASA website may not have data organized for us, but this agency publishes a lot of information relevant to the public. The caveat is that it is in PDF format. This is our first challenge.
The publications are categorized into 'Climatological Normals' and 'Climatological Extremes'. Each weather station has a corresponding publication for each category. There are 54 PAG-ASA weather stations around the country. In total, that would amount to 118 PDFs we need to extract data from.
The first step to getting the data in a speedy way is to create a script to automate it. I created a Jupyter notebook which will hold all extractions and transformation scripts which will export the organized clean data to a CSV file the dashboard can use.
I started with the web-scraping part. I used Selenium library to achieve this. This snippet gets all the download links of the PDF files, loops in each one of them and then saves it on a separate folder per category. Once all the PDFs are downloaded, we'll proceed to the next step which is extracting the data from each file.
Extracting Data from PDFs
In each of these PDF files contains information about the weather station and a table containing monthly data for each weather feature. Also, the header is not organized in a easy-to-extract way as it contains merged columns as well as other non-standard formatting.
I used the library PDFQuery to transform the pdf into an xml, which is a more computer readable format. After ide
Data Cleaning & Transformations
Dashboard Creation
Tags:
#python #tableau #dashboard #pandas #climate #philippines #etl